
WordPress Core Web Vitals: What Each Metric Means and How to Fix It
TL;DR — Core Web Vitals on WordPress: If your Core Web Vitals assessment failed in Search Console, fix the metric that failed: LCP (hero images, fonts, server response), INP (JavaScript on the main thread), or CLS (layout shifts from ads, fonts, or unsized images). Use field data in PageSpeed Insights — not lab scores alone — then work through the checklist below.
WordPress Core Web Vitals problems are usually three specific things wearing a trench coat: an oversized hero image, a theme or page builder shipping far more CSS and JavaScript than the page uses, and third-party scripts fighting over the browser’s main thread. Almost everything below is a variation on fixing one of those.
But you can’t fix what you’re measuring wrong, and a large share of the time people spend on this is wasted because they’re optimizing a Lighthouse score on a desktop connection while their real users are on mid-range Android phones over cellular. So this starts with what the metrics are, what the thresholds are, and which data source counts.
The three metrics and their real thresholds
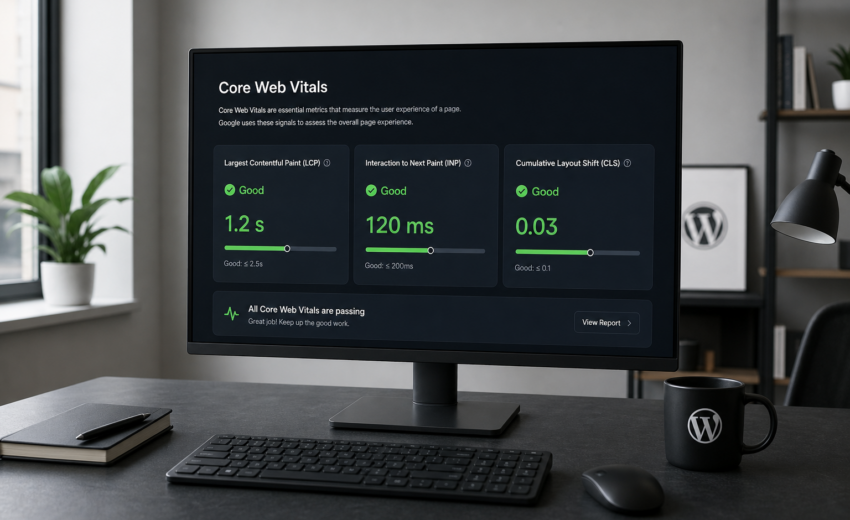
Core Web Vitals is currently three metrics. Each has three bands, and each is assessed at the 75th percentile of real page loads — three out of four visits must hit “good” for the page to pass. Mobile and desktop are assessed separately.
| Metric | What it measures | Good | Needs improvement | Poor |
|---|---|---|---|---|
| LCP — Largest Contentful Paint | Time until the largest visible content element finishes rendering | ≤ 2.5s | 2.5s – 4.0s | > 4.0s |
| INP — Interaction to Next Paint | Overall responsiveness: latency from input to the next visual update | ≤ 200ms | 200ms – 500ms | > 500ms |
| CLS — Cumulative Layout Shift | Unexpected movement of visible content during the page’s lifespan | ≤ 0.1 | 0.1 – 0.25 | > 0.25 |
A few clarifications worth having straight:
INP replaced FID in March 2024. First Input Delay only measured the delay before the browser *began* processing your first interaction. It was easy to pass and told you little. INP measures the full round trip — input to processing to the next frame painted — across all interactions on the page, and reports roughly the worst one. Many sites that scored perfectly on FID fail INP, and that’s the metric doing its job.
LCP measures the largest element, usually an image or a heading block. Not the whole page load, not DOMContentLoaded.
CLS excludes shifts within 500ms of a user interaction. Opening an accordion is expected movement. An ad injecting itself above the fold three seconds in is not.
TTFB and FCP aren’t Core Web Vitals but they’re the diagnostics that explain your LCP. Good targets are under 800ms and under 1.8s respectively.
Field data vs lab data
This distinction causes more confusion than anything else in performance work.
Field data is real measurement from real Chrome users on real devices and connections, aggregated in the Chrome UX Report (CrUX). This is what Google uses for the assessment. It appears in the top section of PageSpeed Insights, in the Core Web Vitals report in Search Console, and in the CrUX API. It’s reported as a 28-day rolling average.
Lab data is a single simulated load under controlled conditions — Lighthouse, the DevTools Performance panel, WebPageTest, and the bottom section of PageSpeed Insights. Reproducible and diagnostic, which makes it excellent for debugging and unreliable for judgment.
What follows from that:
Field data wins. You can score 98 in Lighthouse on office fiber and still fail in the field, because a quarter of your visitors are on a three-year-old Android over spotty LTE. If field and lab disagree, field is correct about your users.
Lab data can’t measure INP properly. INP requires actual interactions. Lighthouse reports Total Blocking Time as a proxy — useful for diagnosis, but it isn’t INP. If your INP is bad in the field, reproduce interactions on a throttled device rather than staring at a Lighthouse number.
Field data lags by up to 28 days. Deploy a fix Monday and the field data barely moves by Friday, because it’s still averaging in three and a half weeks of the old experience. Judge fixes on a lab re-test immediately, then confirm in the field a month later. Rolling back a good fix on day three because “nothing changed” is a real thing that happens.
Search Console groups URLs by template. A low-traffic URL gets assessed using origin-level or group-level data, which is why a page can show as failing when you’ve never seen it slow.
If you have no field data at all, your site doesn’t get enough Chrome traffic to populate CrUX. Install the web-vitals JavaScript library and collect your own real-user measurements, or work from lab data on a throttled mobile profile and accept the uncertainty.
Fixing LCP on WordPress
LCP is the metric most WordPress sites fail. It decomposes into time to first byte, resource load delay, resource load time, and render delay. Work them in that order.
Get TTFB under control first
TTFB sets a floor under LCP. If your server takes 900ms to return HTML, a 2.5s LCP requires everything else to be nearly instant.
- Page caching is non-negotiable. WP Rocket, LiteSpeed Cache, FlyingPress, or a host-level cache. Serving cached HTML skips PHP and MySQL entirely. Installing a caching plugin and never configuring it is extremely common — verify with a response header check that pages are actually served from cache.
- Fix the hosting if it’s the problem. Cheap shared hosting frequently returns 600–1,200ms TTFB on cached pages, and no front-end work fixes that. Moving to decent managed hosting is often the single largest available improvement.
- Use a CDN with HTML caching. Cloudflare’s APO, BunnyCDN, or your host’s edge cache put HTML physically closer to visitors.
- Check PHP version and object caching. PHP 8.2+ with OPcache, and Redis or Memcached for dynamic pages that can’t be fully cached.
- Audit slow plugins. Query Monitor shows which plugin runs 40 queries on every page load. Related-posts plugins, some security plugins, and poorly written sliders are frequent offenders.
Fix the LCP element itself
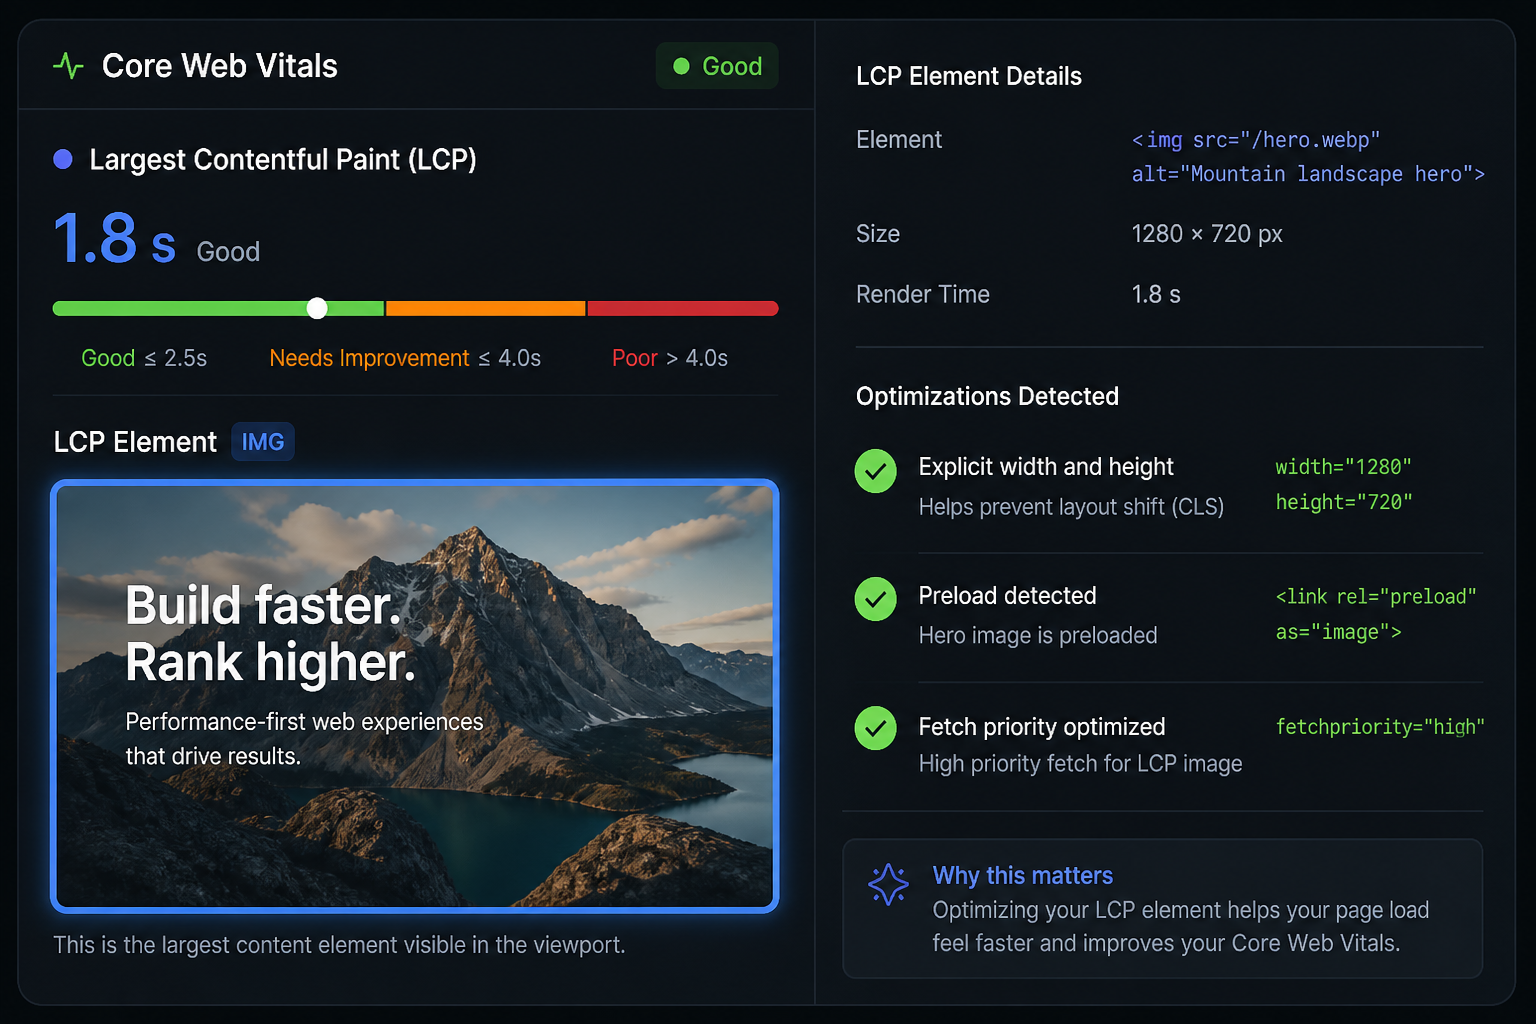
Identify what the LCP element actually is before touching anything — PageSpeed Insights names it. Usually it’s the hero image; sometimes it’s a heading blocked by a web font.
If it’s an image:
- Serve it at display size. A 3000px-wide export shown at 1200px is the most common single WordPress performance bug.
- Use modern formats. WebP or AVIF, typically 30–60% smaller than equivalent JPEG. Most caching and image plugins convert automatically.
- Never lazy-load the LCP image. WordPress adds
loading="lazy"automatically, and lazy-loading the above-the-fold hero delays the exact thing being measured. Core skips the first image on a page, but page builders and themes routinely defeat this. Inspect the rendered HTML and setloading="eager"andfetchpriority="high"explicitly. - Preload it. A
starts the download during HTML parse rather than after CSS resolves. - Set explicit width and height — helps CLS, and lets the browser allocate layout early.
- Skip the background-image hero. CSS background images are discovered late and can’t be preloaded as easily. Use a real
object-fit: cover.
If it’s text:
- Preload the font used above the fold, and use
font-display: swapso text renders in a fallback immediately rather than staying invisible. - Self-host fonts rather than loading from a third-party origin.
- Subset aggressively. Latin-only subsets are a fraction of full character sets, and most sites ship weights they never use.
Remove render-blocking resources
- Inline critical CSS for above-the-fold content and load the rest asynchronously. WP Rocket, LiteSpeed, and Perfmatters all do this; test carefully, because a wrong critical set causes a flash of unstyled content.
- Remove unused CSS. This is where page builders hurt most — 400KB of stylesheet for a page using 12KB. Removal tools help but can break things, so test every template type.
- Defer non-critical JavaScript. Nothing in the head should be a synchronous script unless it must be.
- Dequeue assets per page. Perfmatters, Asset CleanUp, or hand-written
wp_dequeue_scriptcalls stop the contact form plugin loading its assets on all 200 pages when it’s used on one.
Fixing INP on WordPress
INP is about main thread availability. The browser can only respond to a tap when the main thread is free, so INP problems are almost always “too much JavaScript running at the wrong time.”
Audit third-party scripts first, and be ruthless. Chat widgets, heatmaps, session recorders, A/B testing tools, social embeds, and every pixel marketing added over three years. Load what you can through Google Tag Manager with sensible triggers, delay the rest until user interaction (most caching plugins have a “delay JavaScript execution” option), and delete anything nobody has opened in six months.
Break up long tasks. Any task over 50ms blocks input. The DevTools Performance panel, recorded with 4x CPU throttling, shows which functions are responsible. In WordPress the culprit is usually a slider library, a heavy carousel, an animation-on-scroll script, or a page builder’s runtime.
Cut jQuery dependencies where you can. Many plugins still load jQuery plus their own bundle. Three plugins doing that means three bundles and a lot of parse time for functionality a few lines of vanilla JavaScript would cover.
Watch for input handlers doing heavy work synchronously. Mega menus recalculating layout on hover, filters re-rendering an entire product grid on every keystroke, accordions animating in JavaScript instead of CSS. Debounce, virtualize long lists, let CSS handle animation.
Test INP the way it’s measured. Open the page on a throttled mobile profile, then actually tap the menu, open the accordion, type in the search box, submit the form. Chrome’s Web Vitals extension reports INP live as you interact. A page nobody interacts with in testing always looks fine.
Fixing CLS on WordPress
CLS is the most fixable of the three, and it’s usually five specific causes.
Images and iframes without dimensions. Set width and height attributes, or a CSS aspect-ratio, so the browser reserves space before the resource arrives. WordPress usually adds dimensions to media library images; content injected by builders and shortcodes often lacks them.
Web font swaps. When a fallback font is replaced by the web font, text reflows if metrics differ. Use size-adjust, ascent-override, and related descriptors on your @font-face fallback, and preload the primary font.
Content injected above existing content. Cookie banners, promo bars, notification strips, ads. If it must appear at the top, reserve its space in the initial layout or overlay it rather than pushing content down.
Sliders and carousels. Many initialize after load and change height as they do. Set a fixed container height or aspect ratio.
Lazy-loaded sections without placeholders. Related posts, reviews, embedded maps — anything loading on scroll needs a reserved container.
Debug CLS in the DevTools Performance panel: record a load, find the Layout Shift entries, and Chrome highlights the exact elements that moved.
What plugins can and can’t do
A good caching and optimization plugin handles page caching, GZIP or Brotli, minification, deferred JavaScript, critical CSS, image conversion, and lazy loading. That’s a real amount of work and worth the license. WP Rocket, LiteSpeed Cache, FlyingPress, and Perfmatters all do a legitimate job.
What no plugin fixes: a 4MB hero image uploaded straight from a camera, a theme loading 900KB of CSS on every page, hosting with a 1-second TTFB, twelve third-party scripts nobody wants to remove, a page builder generating deeply nested markup and a large JavaScript runtime, or a content structure requiring 40 database queries per page.
Also worth saying: stacking optimization plugins makes things worse. Two caching plugins, two minifiers, and two lazy-load implementations will conflict, and diagnosing the mess takes longer than starting from one clean setup. Keeping a single configured stack in good order over time is what WordPress maintenance is for.
Practical order of operations
Working out of sequence is how people spend a weekend on minification and see nothing change.
- Measure. Field data from PageSpeed Insights and Search Console, plus lab runs on your three most important templates — home, a service page, a post. Save the numbers.
- Fix TTFB. Caching configured and verified, hosting adequate, PHP current, CDN in front.
- Fix the LCP element. Right size, right format, eager, preloaded, dimensions set.
- Cut render-blocking CSS and JS. Critical CSS, deferred scripts, per-page asset dequeuing.
- Fix CLS. Dimensions everywhere, font metrics matched, space reserved for injected content.
- Fix INP. Audit third parties, delay non-essential scripts, break up long tasks.
- Re-measure in lab immediately, then in field after 28 days.
The step-by-step version is in the full WordPress speed checklist.
When the answer isn’t optimization
Sometimes the honest recommendation is that the site can’t get where you need it to be. If the theme is a multipurpose commercial theme layered with a page builder, and page weight is 4MB before content, you can spend $1,500 to move LCP from 5.2s to 3.4s — better, still failing.
The signals that you’re past optimization and into rebuild territory: the page builder is unavoidable in the markup, unused CSS is the majority of your stylesheet, the theme loads its full asset set on every template, and you’re maintaining plugins whose only job is compensating for the theme. At that point a website redesign on a lean foundation costs more up front and gets you to green.
FAQs
What are the current Core Web Vitals thresholds? LCP at or under 2.5 seconds, INP at or under 200 milliseconds, and CLS at or under 0.1 — all assessed at the 75th percentile of real user visits, with mobile and desktop measured separately. Above those and up to 4.0s, 500ms, and 0.25 respectively is “needs improvement”; beyond that is “poor.”
Is INP the same as FID? No. INP replaced FID as a Core Web Vital in March 2024. FID measured only the delay before the browser started processing the first interaction, which most sites passed easily. INP measures full latency from input to the next paint, across all interactions during the visit. Sites that passed FID comfortably often fail INP.
Why does my Lighthouse score say 95 but Search Console says I’m failing? They measure different things. Lighthouse is a single simulated load on your machine. Search Console reports Chrome UX Report field data — real visits from real users on real devices, many slower than yours. Field data is what counts for the assessment.
How long until Core Web Vitals improve after I fix something? Lab data improves the moment you deploy. Field data uses a 28-day rolling window, so expect around four weeks before Search Console reflects the change, with partial movement after a week or two. Don’t judge a fix on day three.
Do Core Web Vitals actually affect rankings? They’re a ranking signal, but a modest one relative to content relevance and links. The clearer commercial case is behavioral: faster pages have lower abandonment and better conversion, and that shows up in revenue whether or not it shows up in rankings.
Can a caching plugin fix Core Web Vitals on its own? It’ll fix a meaningful portion — usually TTFB and some render-blocking issues. It won’t fix oversized images, a bloated theme, third-party script overload, or layout shift from injected content. Expect it to get you part of the way, with manual work closing the gap.
My site passes on desktop but fails on mobile. What now? That’s the normal pattern, and mobile is the assessment that matters most for most sites. Mobile devices have less CPU and slower networks, so JavaScript-heavy pages that feel instant on a laptop take seconds on a phone. Reduce JavaScript, serve smaller images to small viewports, and test on a throttled mobile profile rather than your own device.
Want to know which of these applies to your site?
Send me your URL. I’ll run field and lab data, tell you which metric is failing and why, and give you a straight answer on whether it’s an optimization job or a rebuild. If it’s three fixes you can do yourself in an afternoon, I’ll tell you that.
Scope, process, and estimates of $250–$1,500 are on the WordPress speed optimization services page.
August 14, 2026
WordPress Speed Checklist: How to Fix a Slow...

August 14, 2026