
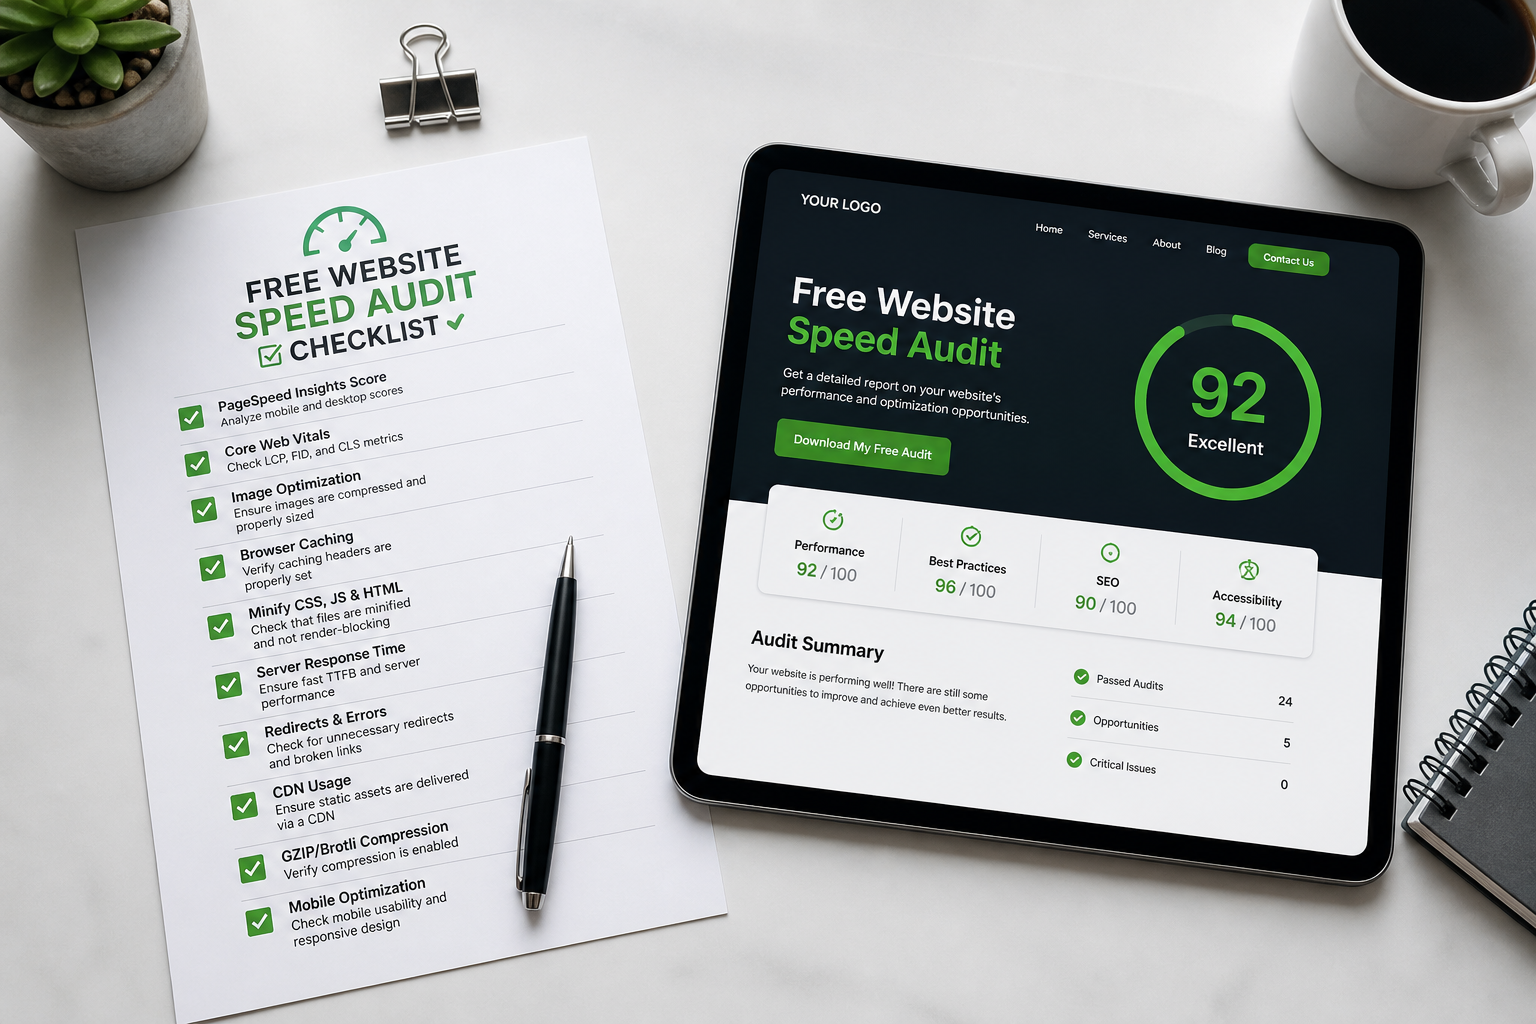
This free website speed audit checklist lets you diagnose slow load times without paying for a consultant — if you're willing to spend 60–90 minutes and interpret the results honestly. Work through each section in order. Server and caching problems should be ruled out before you chase front-end tweaks.
If you get stuck or the same metrics stay red after fixes, that's when a professional website performance audit pays for itself.
Before you start
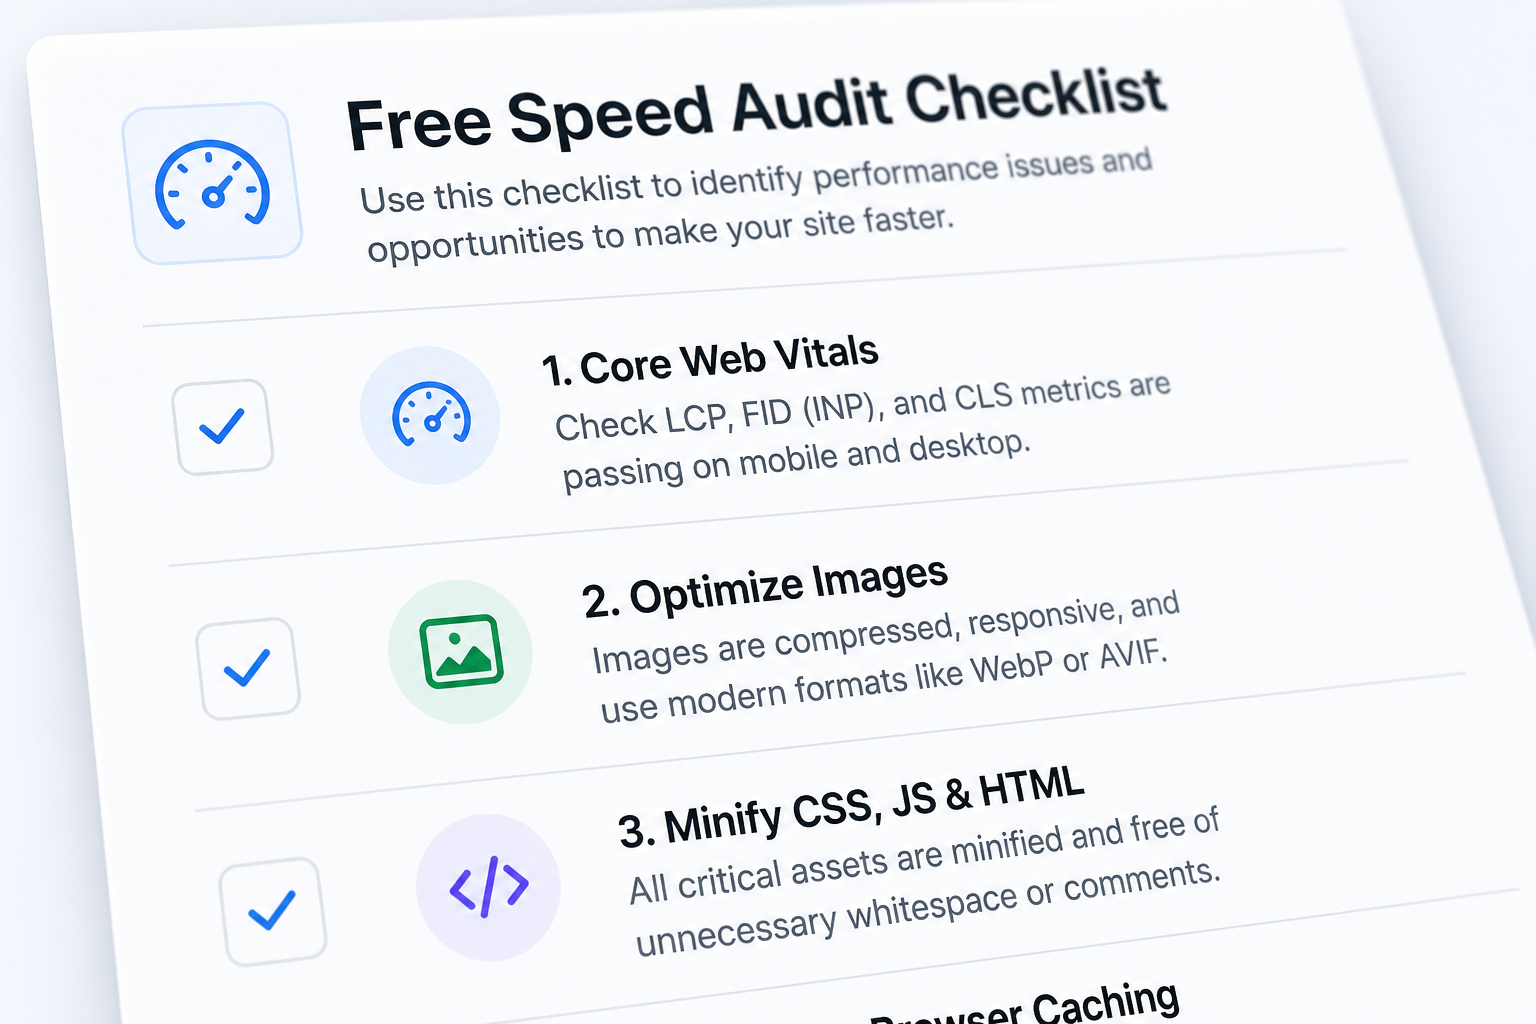
Gather these upfront:
- Homepage URL and one high-traffic inner page (blog post, product, landing page)
- Google Search Console access (optional but strongly recommended)
- WordPress admin access if applicable
- Hosting provider name and plan tier
Test on mobile first. Mobile is where most sites fail Core Web Vitals, and mobile throttling exposes problems desktop hides.
Section 1: Baseline scores (15 minutes)
| Step | Tool | What to record |
|---|---|---|
| Run PageSpeed Insights on homepage | pagespeed.web.dev | Mobile + desktop performance score, LCP, INP, CLS |
| Check Search Console → Experience → Core Web Vitals | search.google.com/search-console | URLs in Poor / Needs improvement buckets |
| Run WebPageTest once | webpagetest.org | TTFB, start render, fully loaded (filmstrip helps) |
Pass criteria: Field data in Search Console shows "Good" for LCP, INP, and CLS on priority URLs. Lab scores are secondary.
Red flag: Lab score is green but Search Console field data is Poor. Trust field data. Your real visitors are on slower devices and networks.
Section 2: Server and caching (15 minutes)
| Check | How | Fix if failing |
|---|---|---|
| TTFB under 600ms on cached page | WebPageTest or PSI "Server response time" | Enable page cache; upgrade hosting |
| Page cache active | View source → look for cache headers; test with cache plugin | Configure WP Rocket, LiteSpeed, or host cache |
| Object cache (Redis/Memcached) | Hosting panel or plugin status | Enable on traffic-heavy WordPress sites |
| CDN serving static assets | DevTools Network → check asset domains | Connect Cloudflare or host CDN |
| PHP version 8.1+ | Hosting panel | Upgrade if on 7.x |
WordPress-specific: confirm caching excludes cart, checkout, my-account, and logged-in users. A cache misconfiguration that breaks checkout is worse than no cache.
See slow TTFB on WordPress for deeper server checks.
Section 3: Images (10 minutes)
| Check | How | Fix if failing |
|---|---|---|
| Hero/LCP image under 200KB (estimate target) | DevTools → Network → filter Img | Compress; convert to WebP/AVIF |
| Width matches display size | Check rendered width vs file dimensions | Serve correct srcset sizes |
| Width and height attributes set | Inspect `<img>` tags | Add dimensions to prevent CLS |
| LCP image not lazy-loaded | View source on hero image | Remove lazy load from above-fold image |
| LCP image preloaded | View source for `<link rel="preload">` | Preload critical hero image |
Oversized uncompressed images remain the most common LCP failure on WordPress. Fix images before installing another performance plugin.
Section 4: CSS and JavaScript (15 minutes)
| Check | How | Fix if failing |
|---|---|---|
| Render-blocking scripts in `<head>` | View source; DevTools Coverage tab | Defer non-critical JS; move scripts to footer |
| Unused CSS over 50KB | Lighthouse "Reduce unused CSS" | Remove page builder bloat; critical CSS or per-page loading |
| jQuery loaded globally but unused on page | DevTools Network | Dequeue on pages that don't need it |
| Font files blocking render | Network tab → filter Font | Preload critical fonts; use font-display: swap |
| Total JS transfer under 500KB on homepage (rough target) | Network tab summary | Audit plugins and theme scripts |
Page builders (Elementor, Divi, WPBakery) often load full CSS/JS libraries on every page. That's a structural issue — note it even if you can't fix it in an afternoon.
Section 5: Third-party scripts (10 minutes)
| Check | How | Fix if failing |
|---|---|---|
| List all third-party domains | DevTools Network → sort by domain | Document each script's purpose |
| Chat widget loads on all pages | Browse 3 different page types | Restrict to contact/sales pages |
| GTM container fires unused tags | GTM Preview mode | Pause or remove dead tags |
| Analytics double-firing | Network tab → multiple gtag/analytics hits | Consolidate tags |
| Social embeds loading on pageload | Look for Facebook/Twitter SDK requests | Lazy load or replace with static links |
Full guide: third-party scripts audit.
Section 6: Core Web Vitals spot checks (10 minutes)
Cross-reference the Core Web Vitals audit checklist:
| Metric | Quick test | Common fix |
|---|---|---|
| LCP | PSI identifies LCP element | Fix hero image, server response, render-blocking CSS |
| INP | Click buttons/menus on mobile throttling | Reduce JS; defer non-critical scripts |
| CLS | Watch page load — does content jump? | Set image/ad dimensions; reserve embed space |
Section 7: WordPress plugin hygiene (10 minutes)
| Check | How | Fix if failing |
|---|---|---|
| Active plugins under 25 (rough guide) | Plugins screen | Deactivate unused; replace overlapping tools |
| No duplicate optimization plugins | Plugin list | One cache plugin, one image optimizer |
| Database autoload under 1MB | Query Monitor or WP-Optimize | Clean autoloaded options |
| Cron not broken | Site Health or WP Crontrol | Fix DISABLE_WP_CRON misconfiguration |
| Theme updated and supported | Theme details | Plan migration if abandoned |
Scorecard template
After completing the checklist, rank findings:
| Priority | Issue | Effort | Impact |
|---|---|---|---|
| P1 | Quick / Medium / Structural | High / Medium / Low | |
| P2 | |||
| P3 |
Fix P1 items first. If three or more P1 items are "Structural," consider a performance audit before redesign instead of stacking quick wins on a weak foundation.
When this checklist is enough
The DIY path works when:
- You found obvious issues (uncompressed hero, cache off, 80 plugins)
- Lab and field data improve after P1 fixes
- The site is small (under 20 pages) on decent hosting
When to stop DIY and hire
- Field data still Poor after two rounds of fixes
- WooCommerce checkout or dynamic pages behave inconsistently
- Stakeholders need a written report with effort estimates
- You can't tell whether the theme or hosting is the bottleneck
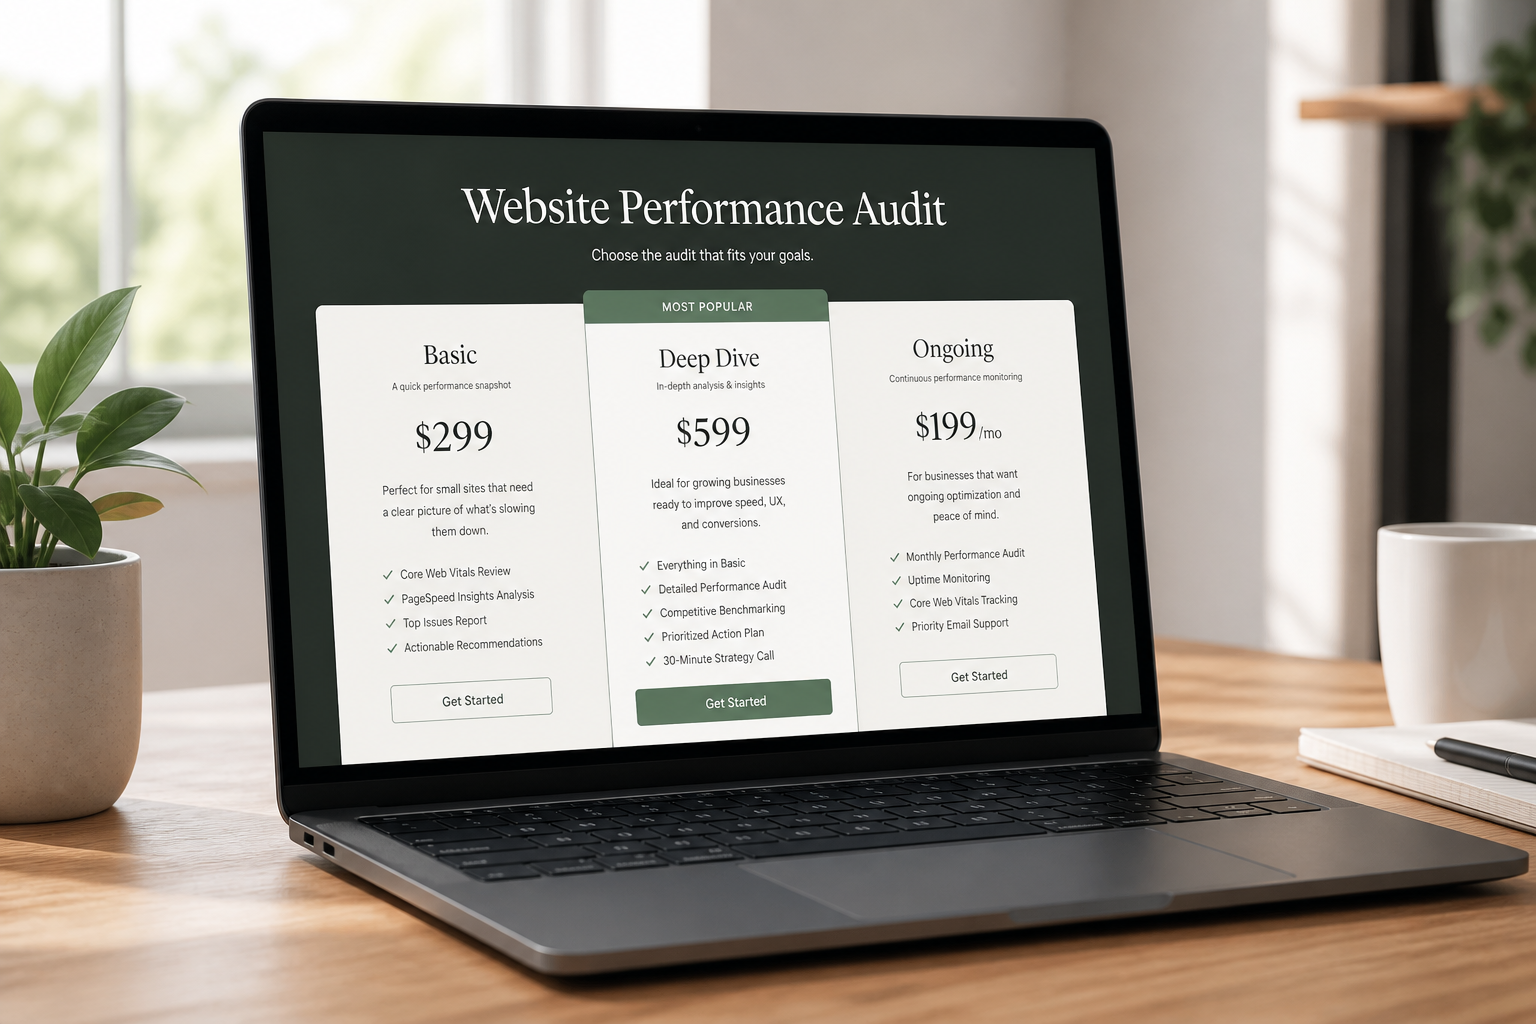
Paid deep-dive audits typically run $150–$500 (estimate) depending on complexity.
Frequently asked questions
How often should I run this checklist?
Quarterly for active sites, or after any major plugin install, theme change, or marketing tag addition.
Is a high PageSpeed score the goal?
No. Core Web Vitals field data and actual load experience matter more. A site can score 90 in lab tests and still fail INP for real users.
Can I use only Lighthouse in Chrome DevTools?
Yes for lab testing, but add Search Console field data. DevTools runs on your machine with your connection — not representative of all visitors.
Do I need to test logged-in and logged-out states?
Test logged-out first — that's what most visitors and Googlebot see. Test logged-in separately if the admin bar, membership content, or cart affects performance.
Will deactivating plugins break my site?
Deactivate one at a time on staging, not production. Never bulk-deactivate on a live store without a rollback plan.
Book a free 15-minute site audit
Done with the checklist and still seeing red metrics? Book a free 15-minute audit. I'll compare your findings against a fresh look and tell you whether a full website performance audit is the next step.
August 5, 2026
What Is a Website Performance Audit?
August 5, 2026