
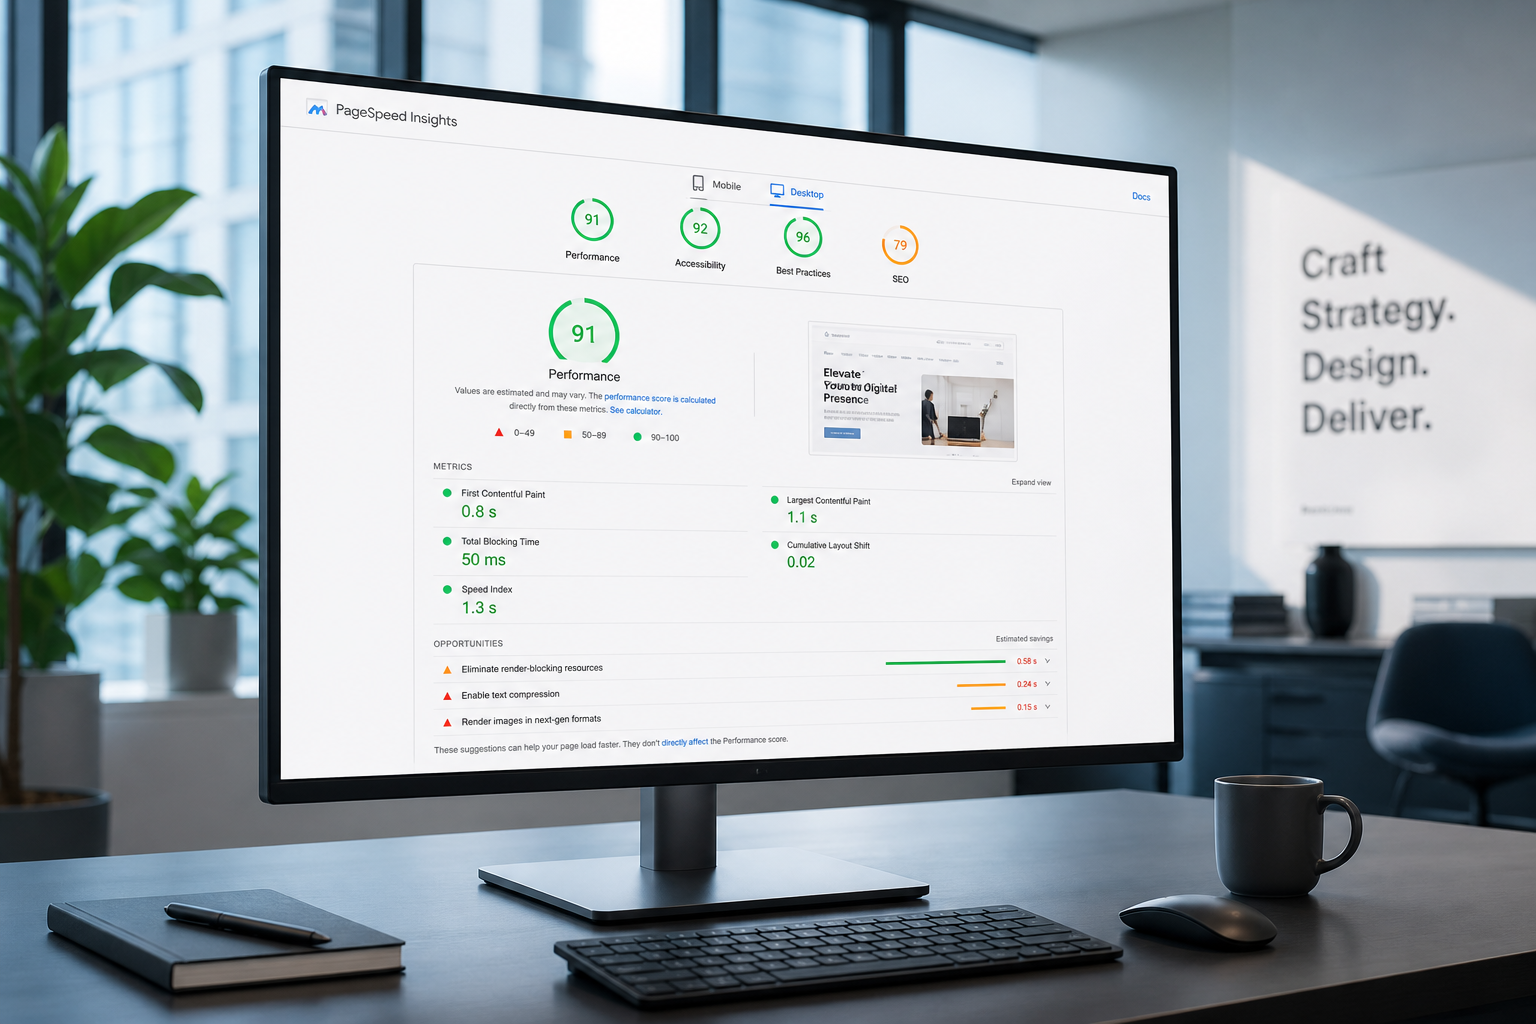
How to read a PageSpeed Insights report starts with one rule: the performance score is not the deliverable. The report exists to show what's slow, what's unstable, and what's blocking interaction — split between real-user data (field) and a simulated test (lab). Most people stare at the 0–100 score, miss the field data section entirely, and fix warnings that don't move Core Web Vitals.
PageSpeed Insights (PSI) runs at pagespeed.web.dev. Enter a URL, wait 30 seconds, and you get two data sources stacked on one page. Understanding which section to trust — and when — saves hours of misdirected work.
Field data vs lab data: read this first
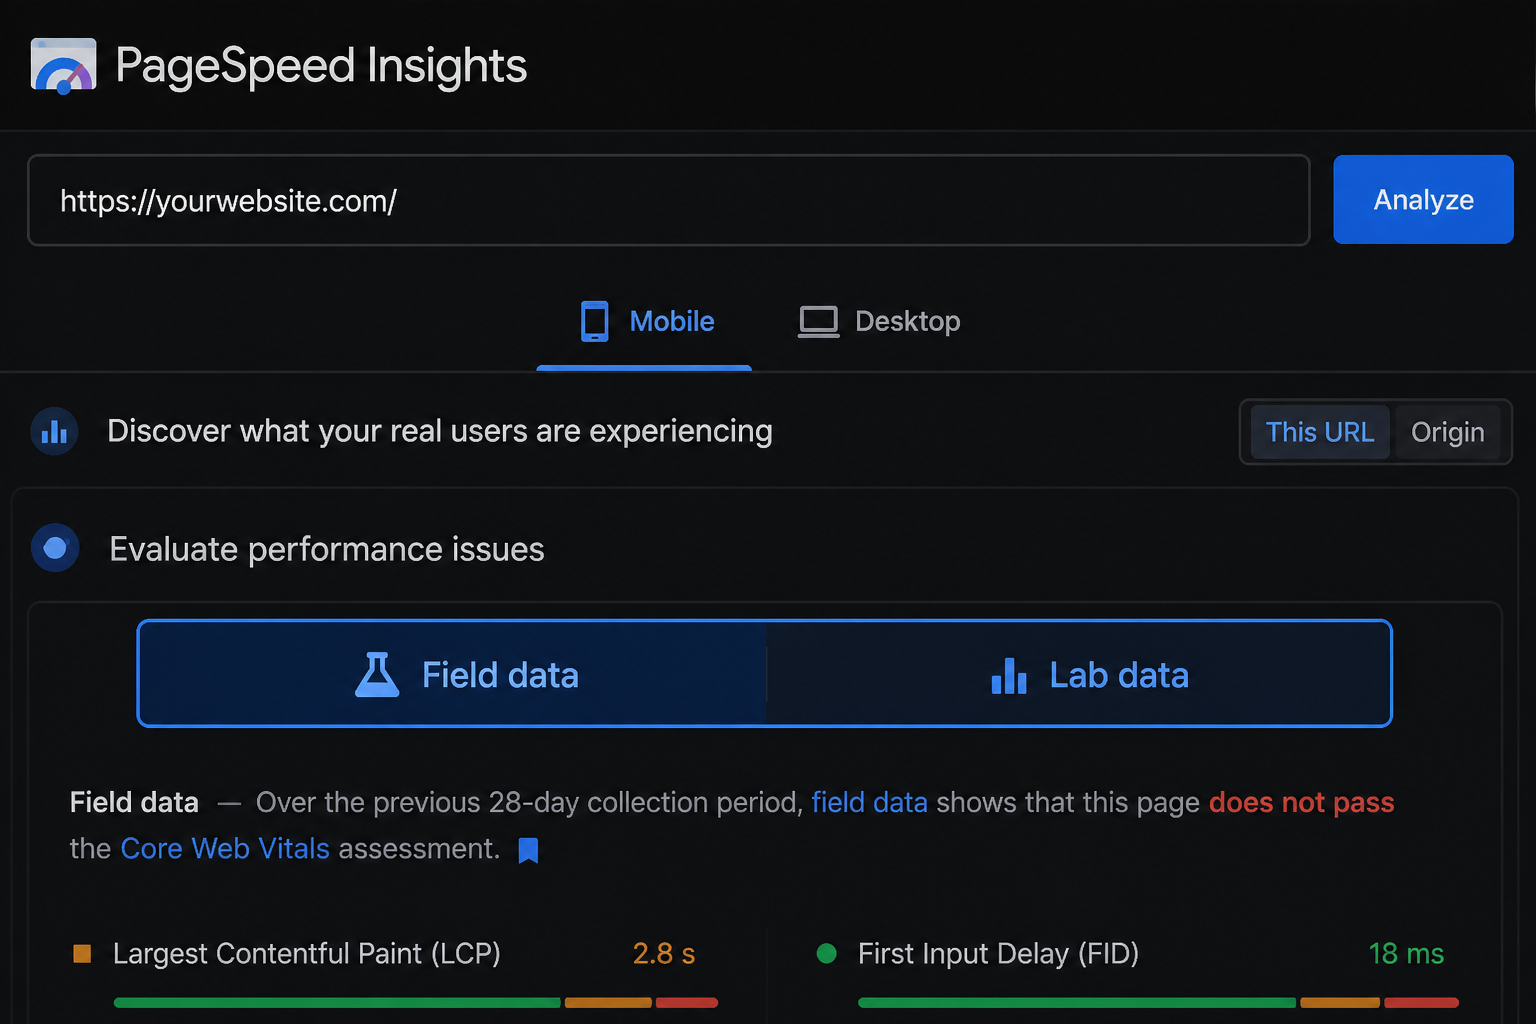
At the top of every PSI report, you'll see "Discover what your real users are experiencing" (field data) and "Diagnose performance issues" (lab data). They measure different things.
| Field data | Lab data | |
|---|---|---|
| Source | Chrome User Experience Report (CrUX) | Lighthouse simulation |
| Represents | Last 28 days of real visits | Single test on Google's server |
| Device | Mix of visitor devices | Emulated mobile or desktop |
| When available | Sites with enough traffic | Always |
| Use for | Confirm real problems | Diagnose causes |
Rule: If field data exists and shows Poor LCP, INP, or CLS, fix for field data. Lab-only failures are worth fixing but lower urgency.
Low-traffic sites may show "No Data" for field metrics. In that case, lab data is all you have — but treat it as a hypothesis until traffic confirms it.
The Core Web Vitals section
Field data displays three metrics with color coding:
| Metric | Good | Needs improvement | Poor |
|---|---|---|---|
| LCP | ≤ 2.5s | 2.5–4.0s | > 4.0s |
| INP | ≤ 200ms | 200–500ms | > 500ms |
| CLS | ≤ 0.1 | 0.1–0.25 | > 0.25 |
Each metric shows the 75th percentile — meaning 25% of visits were worse than the number displayed. That's why a "Good" LCP of 2.3s can still feel slow to your slowest visitors.
Click each metric for distribution charts. A URL with LCP mostly in "Good" but a long tail in "Poor" needs different fixes than a URL uniformly Poor.
Cross-check with Search Console → Experience → Core Web Vitals. PSI and Search Console pull from the same CrUX source but group URLs differently.
The performance score (lab)
The 0–100 score comes from Lighthouse weights:
| Category | Weight (approx.) |
|---|---|
| Performance | Scored metric |
| Accessibility | Separate score |
| Best Practices | Separate score |
| SEO | Separate score |
Within Performance, Lighthouse weights metrics roughly as: LCP (~25%), TBT/INP proxy (~30%), CLS (~25%), FCP (~10%), Speed Index (~10%). Exact weights change between Lighthouse versions — don't memorize them, just know LCP, interactivity, and CLS drive most of the score.
A score of 50 doesn't mean "half fast." It means the simulated test hit multiple thresholds. Two sites with the same score can have completely different root causes.
Opportunities vs diagnostics
Scroll past the score to two lists:
Opportunities
Actionable suggestions with estimated savings (e.g., "Properly size images — Est savings of 1.2s"). These are sorted by estimated impact in the lab test.
Fix first: Opportunities with high savings that map to a failing Core Web Vital in field data.
Deprioritize: Opportunities with tiny savings (< 0.1s) or that require architectural changes for marginal gain.
Diagnostics
Informational items — not always fixable, not always impactful. Examples: "Avoid enormous network payloads," "Minimize main-thread work."
Use diagnostics to understand *why* an opportunity exists, not as a to-do list.
Key lab sections to read
Largest Contentful Paint element
Lighthouse identifies the LCP element — usually a hero image, heading block, or video poster. Note:
- Is it an image? Check size, format, lazy loading, preload status.
- Is it text? Render-blocking CSS or slow TTFB is likely.
- Is LCP different on mobile vs desktop? Test both tabs in PSI.
Deep dive: fix Largest Contentful Paint.
Total Blocking Time / INP proxy
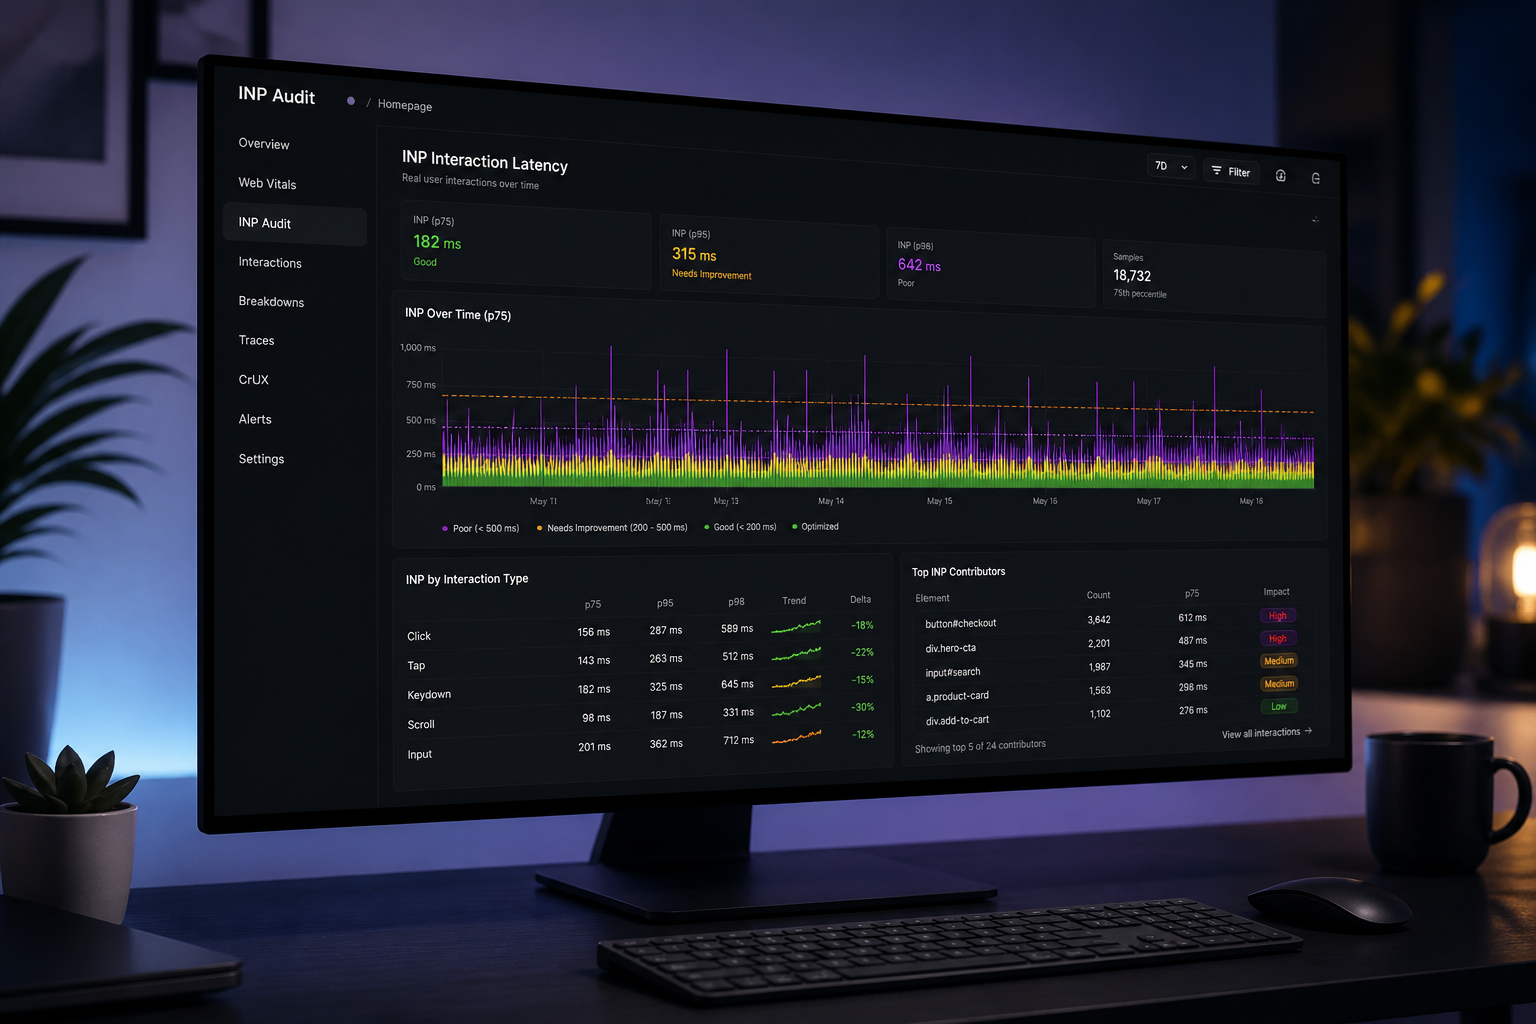
Lab tests use Total Blocking Time (TBT) as an INP proxy. High TBT means JavaScript is monopolizing the main thread.
Look at:
- Main-thread work breakdown in diagnostics
- Third-party script contribution
- Long tasks over 50ms in the performance trace (DevTools → Performance)
Cumulative Layout Shift
Lighthouse lists layout shift culprits — images without dimensions, ads, embeds, web fonts. Each shows its CLS contribution.
Network request waterfall (via DevTools)
PSI doesn't show a full waterfall. For that, open Chrome DevTools → Network while loading the same URL, or use WebPageTest. Waterfalls reveal TTFB delays, render-blocking chains, and third-party script order.
Mobile vs desktop tabs
PSI runs separate lab tests for mobile and desktop. Always check both.
Common pattern: desktop passes, mobile fails. Causes include heavier JS execution on mobile CPUs, unoptimized images in mobile viewport, and render-blocking resources that desktop absorbs.
Guide: mobile PageSpeed lower than desktop.
What to ignore (or deprioritize)
| Warning | Why it often doesn't matter |
|---|---|
| "Serve static assets with efficient cache policy" on third-party scripts | You don't control Facebook's cache headers |
| "Uses deprecated APIs" | Usually minor unless breaking functionality |
| "Avoid multiple page redirects" with one 301 | One redirect is normal |
| Perfect 100 score pursuit | Diminishing returns past Core Web Vitals thresholds |
| Every "Best Practices" flag | Best Practices ≠ Performance |
Practical reading workflow
- Check field data — any Poor vitals?
- Note LCP element from lab section
- Read top 3 Opportunities with highest savings
- Cross-reference Opportunities against failing field metrics
- Check mobile and desktop separately
- Log findings in a Core Web Vitals audit checklist
- Fix in order: TTFB → LCP element → render-blocking resources → third-party scripts → CLS
When PSI isn't enough
PageSpeed Insights doesn't show:
- Server-side plugin conflicts (WordPress)
- Tag Manager container internals
- Per-template asset loading differences
- Checkout/cart performance under load
That's where a full website performance audit adds context PSI can't provide.
Frequently asked questions
Why does my PageSpeed score change every run?
Lab scores vary with network simulation noise, server response fluctuation, and Lighthouse version updates. Look at trends over multiple runs, not single scores.
Why is field data missing?
CrUX requires sufficient traffic over 28 days. New sites and low-traffic pages often show no field data.
Is PageSpeed Insights the same as Lighthouse?
PSI uses Lighthouse for lab data but wraps it with CrUX field data and tests from Google's infrastructure. Running Lighthouse locally tests from your machine — results will differ.
Does a green PSI score guarantee good rankings?
No. Page experience is one signal among hundreds. Good vitals remove a tiebreaker disadvantage; they don't replace content, links, and relevance.
Should I test with or without cache?
Test the cached experience visitors get — that's usually the production URL. If cache is broken, PSI exposes that as high TTFB.
Book a free 15-minute site audit
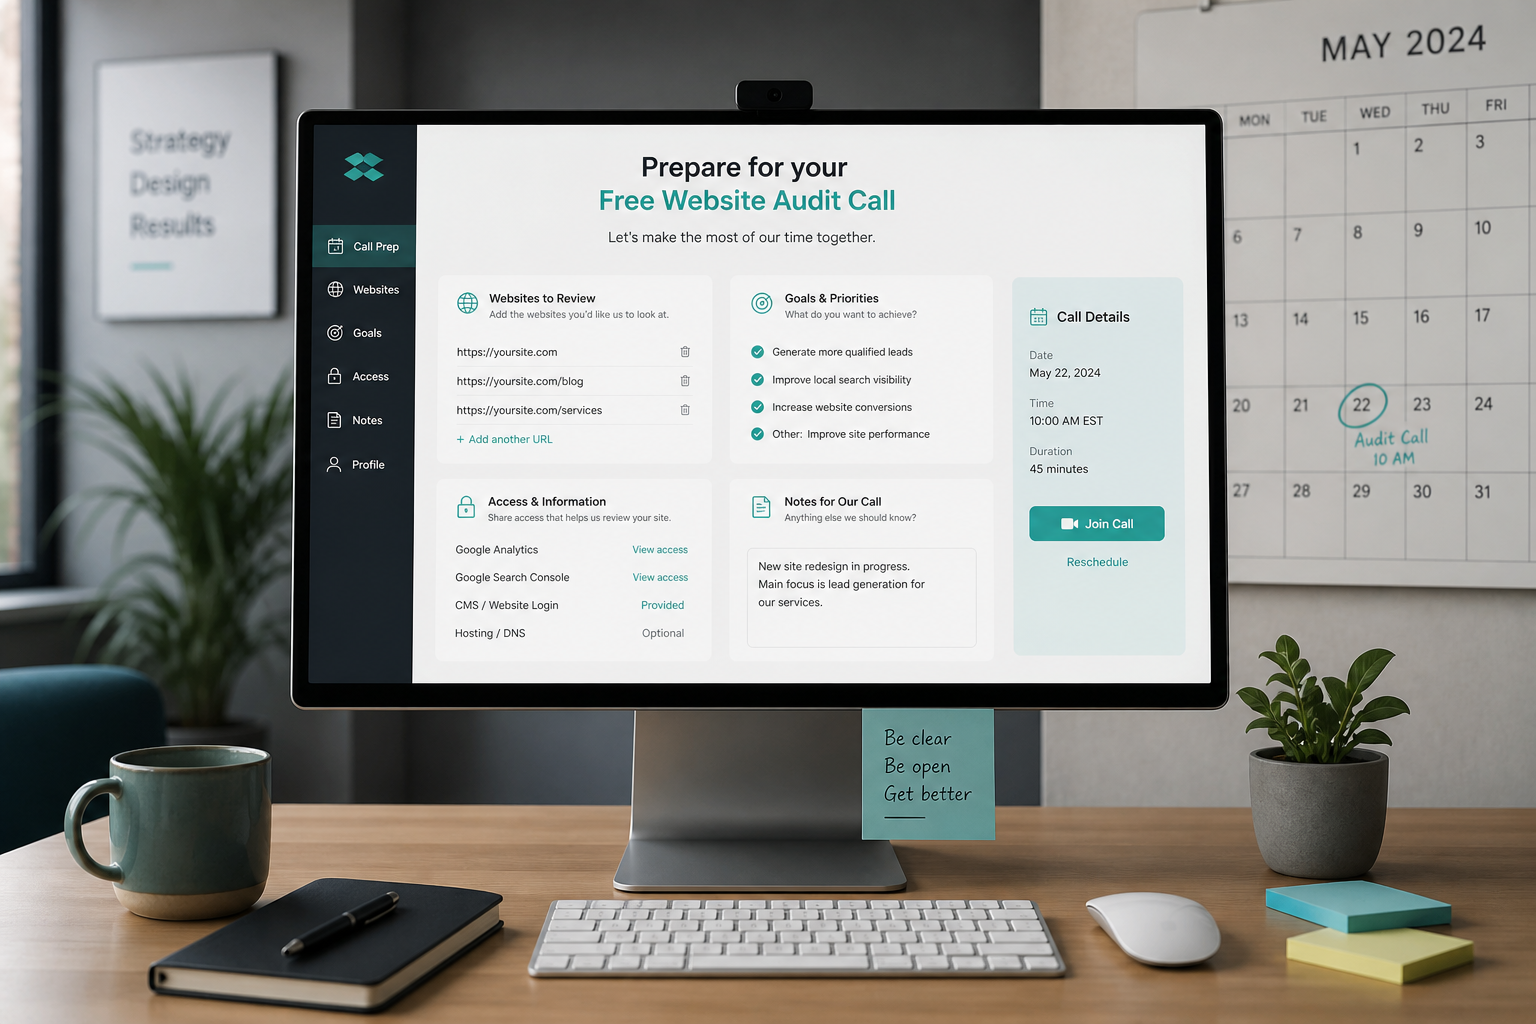
Paste your PageSpeed URL into a free 15-minute call and I'll walk through field vs lab data with you — which warnings matter and which you can skip. If the report needs deeper analysis, we'll scope a full website performance audit.
August 5, 2026
How to Prepare for a Free Website Audit...
August 5, 2026